In this tutorial, we'll look at how to build server-side UI components in Django with django-viewcomponent, which can help you reuse code and keep your code clean and maintainable.
Video tutorials for modern ideas and open source tools.

The class hierarchy for built-in exceptions

Un florilège de trucs bizarres en Python
With the release of Shapely 2.0, the GeoPandas-based code that have been optimised years ago may no longer provide the best performance. This workshop will show you how to change that and write efficient and convenient GeoPandas code that uses the benefits of the latest developments in the Python geospatial ecosystem.
On-and-off over the past few months I wrote a new tool called Protokolo. I wrote earlier about how I implemented internationalisation for this project. This blog post is a simple and short introduction to the tool.
via Bearstech
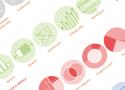
👋 The Python Graph Gallery is a collection of hundreds of charts made with Python.
Graphs are dispatched in about 40 sections following the data-to-viz classification. There are also sections dedicated to more general topics like matplotlib or seaborn.
Each example is accompanied by its corresponding reproducible code along with comprehensive explanations. The gallery offers tutorials that cater to beginners to help kickstart their journey, as well as advanced examples that demonstrate the potency of Python in the realm of data visualization.
The Python Graph Gallery has always been a reservoir of inspiration, providing hundreds of foundational chart examples for newcomers and seasoned developers alike.
While our vast collection offers a stepping stone into the world of data visualization, the following list stands out.
Every chart here represents the pinnacle of craftsmanship, exhibiting the depths to which matplotlib can be customized. These are not just graphs; they are polished masterpieces, ready for publication.
While I'm deeply indebted to the original authors for their stellar work, it's worth noting that many of these visualizations were first conceived in R, a testament to its rich visualization ecosystem. In an endeavor to bring the best to our Python community, I've translated these gems to further showcase the versatility and power of matplotlib.
Dive in and get inspired! 😍
“A commanding view of your test-coverage”.
The tool cuv provides console tools to show coverage data for you Python project nicely in the console. It uses colour and unicode characters.
This article details the differences between developing an application with Vue and Django REST Framework (DRF) versus HTMX and Django. We'll look into a simple example of how both combinations work and compare their strengths and weaknesses.
Botasaurus is an all-in-one web scraping framework that enables you to build awesome scrapers in less time. It solves the key pain points that we, as developers, face when scraping the modern web.

Example code from Head First Design Patterns second edition translated to python to help me understand and memorise the patterns.

Depuis quelque temps, j'ai envie de faire de la génération d'images. Ben pourquoi pas avec Python ?
Le code : https://github.com/villares/sketch-a-day/tree/main/2024/sketch_2024_04_01

Voilib offers semantic search in thousands of minutes of high-quality transcriptions of podcasts. Just type your query and it will find related content in thousands of episodes. Voilib also allows users to index their own audio files.